Church Giving Statistics 2026: What the Latest Data Reveals
Americans gave a record amount to charity in 2025, but churches didn't share equally in that growth. Explore the latest church giving statistics for 2026, including original Tithely data from more than 11 million gifts.
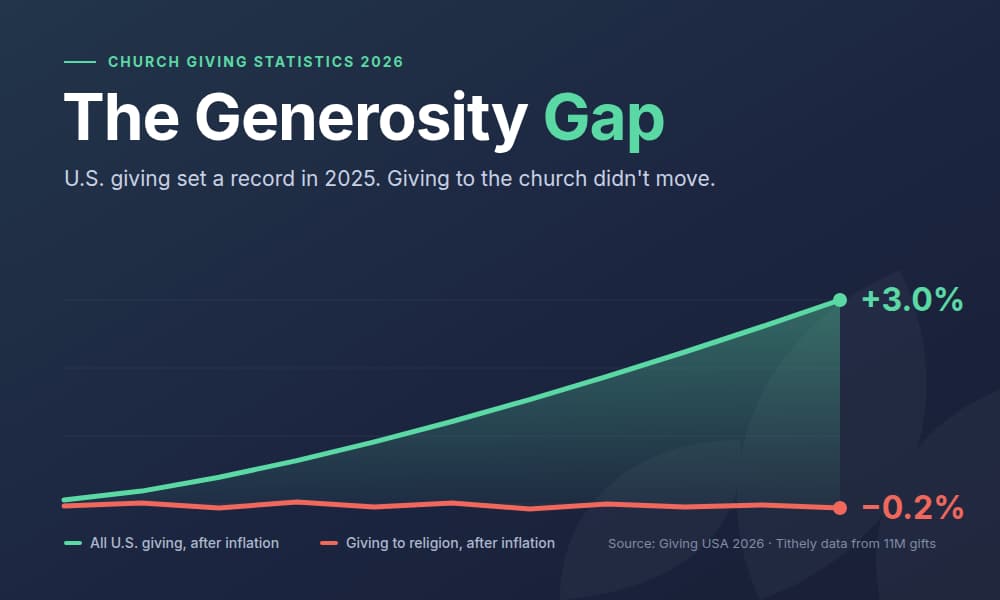



Americans gave more to charity in 2025 than in any year on record. However, giving to the church didn't move.
That gap is the subject of The Generosity Gap, Tithely's 2026 Church Generosity Report. We set national research from Giving USA, MortarStone, Lake Institute, and Cerulli Associates against a full year of our own platform data from 53,000 churches.
Below are the headline findings, what they mean for your church, and where to go for the full playbook.
Download the full report: The Generosity Gap (free)
Key church giving statistics for 2026
If you only need the numbers, here they are.
- $617.2 billion: total U.S. charitable giving in 2025, the first year it has ever passed $600 billion (Giving USA 2026).
- −0.2%: change in religious giving in 2025 after inflation. Religion was the only operating sector that did not grow (Giving USA 2026).
- 24.6%: religion's share of all U.S. charitable dollars in 2025, down from roughly half in the early 1990s (Giving USA; Lake Institute).
- −30%: decline in median household church giving since 2022 (MortarStone 2025).
- 21.2%: share of annual church giving that now comes from the top 1% of givers (MortarStone 2025).
- 39%: share of all church gifts made on a Sunday (Tithely transaction data, 2025).
- 11.8%: share of the year's giving that arrives in December (Tithely).
- 17% of gifts carry 64% of dollars: the largest gifts on the platform (Tithely).
- 81%: share of Sunday-morning giving-form visits made on a mobile device (Tithely).
- 3.4 to 1: number of millennial givers it takes to replace the annual giving of one boomer household (MortarStone 2025).
A record year that passed the church by
Giving USA's 2026 report put total American charitable giving at $617.2 billion for 2025, up 5.7% in current dollars and 3.0% after inflation. Individuals gave $394.2 billion of it. Bequests jumped 16.6% after inflation.
Religion remained the largest recipient category at $151.58 billion. In current dollars it grew 2.4%. Adjusted for inflation, it fell 0.2%.
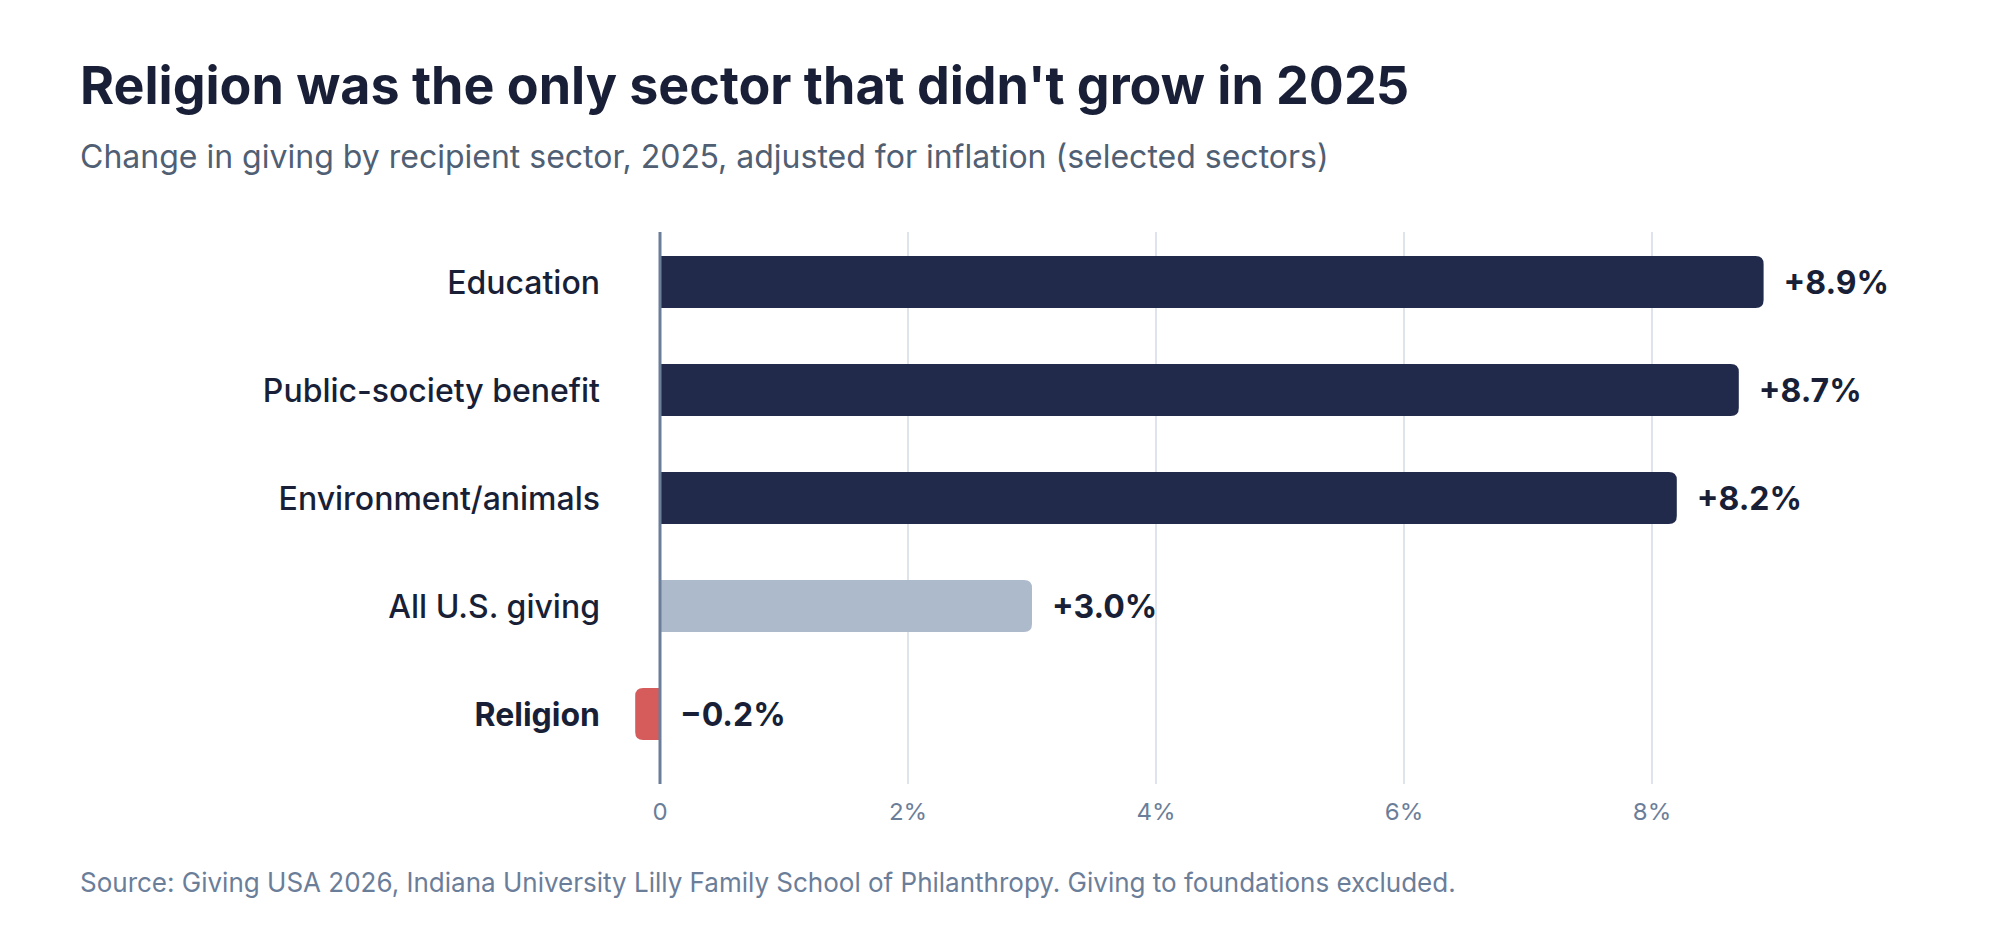
It's tempting to call that "basically flat." But education grew 8.9% after inflation. Public-society benefit grew 8.7%. The environment grew 8.2%. Those causes competed for the same household budgets in the same economy, and they won.
The church didn't lose a fight with the economy. It lost a fight for attention with every other cause asking for donations.
Inflation also hides a quieter decline. Consumer prices rose 24.4% between 2020 and 2025. A family giving $200 a month in 2020 and still giving $200 today has cut its real giving by about a fifth without ever deciding to give less. If your giving is flat in dollars year over year, it fell in real terms.
Fewer givers are carrying more of the load
The national record wasn't built by more Americans giving. It was built by a small number giving very large amounts: megagifts totaled $19.2 billion in 2025.
The same pattern shows up inside local churches. MortarStone's 2025 Annual Generosity Report found that median household giving fell from $800 to $562 between 2022 and 2025, while giving from the top 1% of givers rose 47%. Fewer than half of households who gave in 2021 gave again in 2025.
That's the real risk. A church whose total looks stable may be a church where the middle has quietly fallen out and a handful of families have covered the difference. One retirement or one relocation, and the gap can't be filled.
The warning isn't about major donors, who are usually deeply committed members. It's about everyone else. The metric that matters most in 2026 isn't total giving. It's how many households gave at all, and how many of them give on a recurring basis.
How people actually give: what 11 million gifts show
This is the part of the report unique to Tithely, because it comes directly from transactions on the Tithely platform in calendar year 2025.
Giving runs on payday, not the church calendar
- Sunday carries 39% of all gifts.
- Friday is the peak non-Sunday day, at 15.4% of weekly dollars.
- The 1st and the 15th carry 13% of monthly dollars between them.
- December carries 11.8% of the year and runs 42% above an average month.
People give when they have money, and most people have money on a schedule. An independent dataset from another giving platform landed within about two points of ours on both Sunday and Friday, which is strong confirmation for this kind of pattern.
Source: Tithely internal transaction data, 2025.
Sunday is the participation day, not the dollar day
Sunday takes 39% of gifts but only 27.7% of dollars. The average Sunday gift is 44% smaller than the average Monday gift, and runs about 29% below the average gift across the year. Sunday is where most people give. It isn't where most money is given.
And Sunday giving happens on a phone. 54% of all giving-form visits happen on Sunday morning, and 81% of those are mobile. That means your most important giving interface is a phone screen, held in a pew, by someone with a minute or two of attention. Every extra field or login prompt is a place where someone who meant to give doesn't.
Churches already sense this. Across feature requests submitted to Tithely in 2025, 50% asked for one-tap giving and 18% asked for automated giving reminders. Churches aren't asking for more features. They're asking for fewer steps. That's the idea behind Tithely Tap, which lets a giver tap their phone on an NFC disc and skip the find-the-link step entirely.
A small minority of gifts carries the budget
The largest 17% of gifts carry 64% of all dollars. At the other end, the smallest 56% of gifts carry 13% between them.
That doesn't mean smaller gifts don't matter. They're the participation base and the leading indicator of everything above. It means churches need two different jobs: stewardship for the larger gift, and a frictionless path for the everyday one.
Recurring giving is the stability layer
On the Tithely platform, recurring gifts make up 41.0% of gifts and 32.6% of giving dollars. The seasonal difference is striking: across June, July, and August, one-time giving ran 5.4% below an average month while recurring giving ran 1.7% above it.
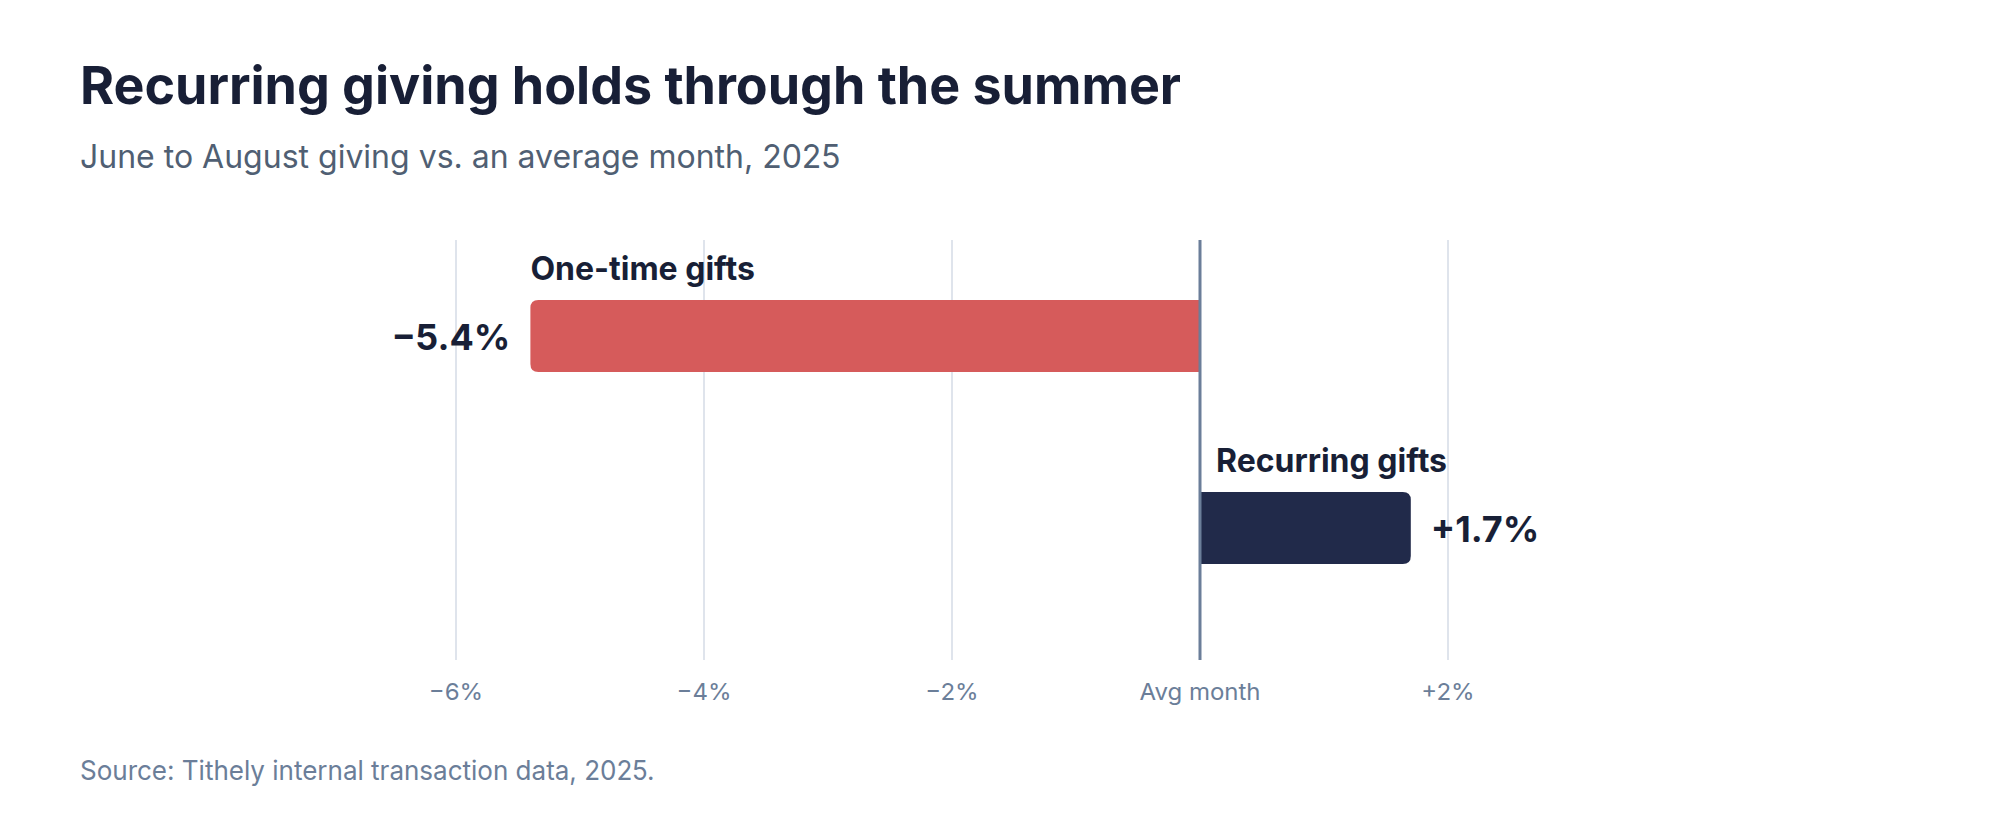
Nobody cancels a recurring gift to go on vacation. Every point of recurring share you add is a point of your budget that stops depending on attendance.
Small friction fixes produce measurable gains
When Tithely rebuilt its giving wallet and A/B tested it against the previous version, the new experience delivered +1.2% dollars per visitor, +0.4% conversion, and 10% fewer errors during giving. None of that came from asking anyone to be more generous. It came from removing steps between intent and completion.
Three more forces reshaping church giving
The full report goes deeper on three trends every church leadership team should understand. Here's the short version.
The generational exchange rate. It takes roughly 3.4 millennial givers, or 10 Gen Z givers, to replace the annual giving of one boomer household. Much of that gap is life stage, not conviction, and it closes over time only if a giving habit is in place early. A 28-year-old giving $25 a month automatically is a strategic success.
The 2026 tax code cuts both ways. Starting in tax year 2026, people who take the standard deduction can deduct charitable gifts up to $1,000 (single) or $2,000 (married filing jointly). Roughly nine in ten households take the standard deduction. At the same time, itemizers face a new 0.5%-of-AGI floor on charitable deductions, and top-bracket filers see the value of itemized deductions capped at 35%. The broad base gets a new incentive; your largest givers get a new headwind. (Share the provisions, and point members to their own tax advisor.)
The wealth transfer is arriving in forms churches can't always accept. Cerulli Associates projects $124 trillion will change hands through 2048, including $18 trillion to charity. Much of it will come through donor-advised funds, IRA qualified charitable distributions, and appreciated stock. Half of Fidelity Charitable donors already recommended grants to religious organizations in 2024. A church that can't receive those gifts cleanly never learns what it missed.
What churches can do this week
The report closes with seven moves, each tied to a specific finding and ordered by effort. The first three cost nothing but a decision. Here are two you can act on today:
- Make recurring giving easy to choose. Keep recurring giving options visible and encourage members to set up a schedule that works for them. With Tithely Giving, donors can choose between one-time and recurring gifts and select their preferred giving frequency and date. Churches can also customize giving links to create a simple, convenient giving experience, with no web developer required for those settings.
- Time the ask to payday. Move giving emails and texts to Thursday or Friday, and align campaign deadlines to the 1st and 15th.
The other five, covering the mobile giving path, participation reporting, failed-payment recovery, non-cash readiness, and impact reporting, are in the full report, along with a suggested sequence for rolling them out.
Get the full report
Download The Generosity Gap: Tithely Church Generosity Report 2026
This post covers the headlines. The full report is built to be helpful for your church; it’s not just a list of facts. Inside:
- The Generosity Health Check: a 15-minute, 40-point self-assessment across five areas that tells you which move to start with.
- All seven moves, in full, with the finding behind each and a week-by-week sequence.
- A 12-month generosity calendar mapped to how people actually give, not the program year.
- The three participation numbers to put in front of your board every quarter.
- The 2026 tax playbook for both your everyday givers and your largest ones.
- A non-cash readiness checklist for DAF grants, QCDs, stock, and bequests.
About the data
Tithely figures come from aggregate, de-identified 2025 data across approximately 53,000 churches using Tithely for digital giving, limited to U.S. dollar transactions and reported as shares rather than amounts. Because the dataset covers digital giving, it over-represents digitally engaged givers and doesn't include cash or check gifts made outside the platform. Public figures are cited to Giving USA 2026 (Indiana University Lilly Family School of Philanthropy), the MortarStone 2025 Annual Generosity Report, Lake Institute on Faith & Giving, Cerulli Associates, Fidelity Charitable, and the U.S. Bureau of Labor Statistics. Full methodology is in the report.
Citing these figures? Please reference The Generosity Gap: Tithely Church Generosity Report 2026 and link to this page.
Sign Up for Product Updates

Chris Dunagan is a marketing strategist focused on church tech and digital engagement. He helps churches grow through SEO, email campaigns, and tools like Tithely and Breeze ChMS, with an emphasis on online giving, content strategy, and digital outreach.
Americans gave more to charity in 2025 than in any year on record. However, giving to the church didn't move.
That gap is the subject of The Generosity Gap, Tithely's 2026 Church Generosity Report. We set national research from Giving USA, MortarStone, Lake Institute, and Cerulli Associates against a full year of our own platform data from 53,000 churches.
Below are the headline findings, what they mean for your church, and where to go for the full playbook.
Download the full report: The Generosity Gap (free)
Key church giving statistics for 2026
If you only need the numbers, here they are.
- $617.2 billion: total U.S. charitable giving in 2025, the first year it has ever passed $600 billion (Giving USA 2026).
- −0.2%: change in religious giving in 2025 after inflation. Religion was the only operating sector that did not grow (Giving USA 2026).
- 24.6%: religion's share of all U.S. charitable dollars in 2025, down from roughly half in the early 1990s (Giving USA; Lake Institute).
- −30%: decline in median household church giving since 2022 (MortarStone 2025).
- 21.2%: share of annual church giving that now comes from the top 1% of givers (MortarStone 2025).
- 39%: share of all church gifts made on a Sunday (Tithely transaction data, 2025).
- 11.8%: share of the year's giving that arrives in December (Tithely).
- 17% of gifts carry 64% of dollars: the largest gifts on the platform (Tithely).
- 81%: share of Sunday-morning giving-form visits made on a mobile device (Tithely).
- 3.4 to 1: number of millennial givers it takes to replace the annual giving of one boomer household (MortarStone 2025).
A record year that passed the church by
Giving USA's 2026 report put total American charitable giving at $617.2 billion for 2025, up 5.7% in current dollars and 3.0% after inflation. Individuals gave $394.2 billion of it. Bequests jumped 16.6% after inflation.
Religion remained the largest recipient category at $151.58 billion. In current dollars it grew 2.4%. Adjusted for inflation, it fell 0.2%.
It's tempting to call that "basically flat." But education grew 8.9% after inflation. Public-society benefit grew 8.7%. The environment grew 8.2%. Those causes competed for the same household budgets in the same economy, and they won.
The church didn't lose a fight with the economy. It lost a fight for attention with every other cause asking for donations.
Inflation also hides a quieter decline. Consumer prices rose 24.4% between 2020 and 2025. A family giving $200 a month in 2020 and still giving $200 today has cut its real giving by about a fifth without ever deciding to give less. If your giving is flat in dollars year over year, it fell in real terms.
Fewer givers are carrying more of the load
The national record wasn't built by more Americans giving. It was built by a small number giving very large amounts: megagifts totaled $19.2 billion in 2025.
The same pattern shows up inside local churches. MortarStone's 2025 Annual Generosity Report found that median household giving fell from $800 to $562 between 2022 and 2025, while giving from the top 1% of givers rose 47%. Fewer than half of households who gave in 2021 gave again in 2025.
That's the real risk. A church whose total looks stable may be a church where the middle has quietly fallen out and a handful of families have covered the difference. One retirement or one relocation, and the gap can't be filled.
The warning isn't about major donors, who are usually deeply committed members. It's about everyone else. The metric that matters most in 2026 isn't total giving. It's how many households gave at all, and how many of them give on a recurring basis.
How people actually give: what 11 million gifts show
This is the part of the report unique to Tithely, because it comes directly from transactions on the Tithely platform in calendar year 2025.
Giving runs on payday, not the church calendar
- Sunday carries 39% of all gifts.
- Friday is the peak non-Sunday day, at 15.4% of weekly dollars.
- The 1st and the 15th carry 13% of monthly dollars between them.
- December carries 11.8% of the year and runs 42% above an average month.
People give when they have money, and most people have money on a schedule. An independent dataset from another giving platform landed within about two points of ours on both Sunday and Friday, which is strong confirmation for this kind of pattern.
Source: Tithely internal transaction data, 2025.
Sunday is the participation day, not the dollar day
Sunday takes 39% of gifts but only 27.7% of dollars. The average Sunday gift is 44% smaller than the average Monday gift, and runs about 29% below the average gift across the year. Sunday is where most people give. It isn't where most money is given.
And Sunday giving happens on a phone. 54% of all giving-form visits happen on Sunday morning, and 81% of those are mobile. That means your most important giving interface is a phone screen, held in a pew, by someone with a minute or two of attention. Every extra field or login prompt is a place where someone who meant to give doesn't.
Churches already sense this. Across feature requests submitted to Tithely in 2025, 50% asked for one-tap giving and 18% asked for automated giving reminders. Churches aren't asking for more features. They're asking for fewer steps. That's the idea behind Tithely Tap, which lets a giver tap their phone on an NFC disc and skip the find-the-link step entirely.
A small minority of gifts carries the budget
The largest 17% of gifts carry 64% of all dollars. At the other end, the smallest 56% of gifts carry 13% between them.
That doesn't mean smaller gifts don't matter. They're the participation base and the leading indicator of everything above. It means churches need two different jobs: stewardship for the larger gift, and a frictionless path for the everyday one.
Recurring giving is the stability layer
On the Tithely platform, recurring gifts make up 41.0% of gifts and 32.6% of giving dollars. The seasonal difference is striking: across June, July, and August, one-time giving ran 5.4% below an average month while recurring giving ran 1.7% above it.
Nobody cancels a recurring gift to go on vacation. Every point of recurring share you add is a point of your budget that stops depending on attendance.
Small friction fixes produce measurable gains
When Tithely rebuilt its giving wallet and A/B tested it against the previous version, the new experience delivered +1.2% dollars per visitor, +0.4% conversion, and 10% fewer errors during giving. None of that came from asking anyone to be more generous. It came from removing steps between intent and completion.
Three more forces reshaping church giving
The full report goes deeper on three trends every church leadership team should understand. Here's the short version.
The generational exchange rate. It takes roughly 3.4 millennial givers, or 10 Gen Z givers, to replace the annual giving of one boomer household. Much of that gap is life stage, not conviction, and it closes over time only if a giving habit is in place early. A 28-year-old giving $25 a month automatically is a strategic success.
The 2026 tax code cuts both ways. Starting in tax year 2026, people who take the standard deduction can deduct charitable gifts up to $1,000 (single) or $2,000 (married filing jointly). Roughly nine in ten households take the standard deduction. At the same time, itemizers face a new 0.5%-of-AGI floor on charitable deductions, and top-bracket filers see the value of itemized deductions capped at 35%. The broad base gets a new incentive; your largest givers get a new headwind. (Share the provisions, and point members to their own tax advisor.)
The wealth transfer is arriving in forms churches can't always accept. Cerulli Associates projects $124 trillion will change hands through 2048, including $18 trillion to charity. Much of it will come through donor-advised funds, IRA qualified charitable distributions, and appreciated stock. Half of Fidelity Charitable donors already recommended grants to religious organizations in 2024. A church that can't receive those gifts cleanly never learns what it missed.
What churches can do this week
The report closes with seven moves, each tied to a specific finding and ordered by effort. The first three cost nothing but a decision. Here are two you can act on today:
- Make recurring giving easy to choose. Keep recurring giving options visible and encourage members to set up a schedule that works for them. With Tithely Giving, donors can choose between one-time and recurring gifts and select their preferred giving frequency and date. Churches can also customize giving links to create a simple, convenient giving experience, with no web developer required for those settings.
- Time the ask to payday. Move giving emails and texts to Thursday or Friday, and align campaign deadlines to the 1st and 15th.
The other five, covering the mobile giving path, participation reporting, failed-payment recovery, non-cash readiness, and impact reporting, are in the full report, along with a suggested sequence for rolling them out.
Get the full report
Download The Generosity Gap: Tithely Church Generosity Report 2026
This post covers the headlines. The full report is built to be helpful for your church; it’s not just a list of facts. Inside:
- The Generosity Health Check: a 15-minute, 40-point self-assessment across five areas that tells you which move to start with.
- All seven moves, in full, with the finding behind each and a week-by-week sequence.
- A 12-month generosity calendar mapped to how people actually give, not the program year.
- The three participation numbers to put in front of your board every quarter.
- The 2026 tax playbook for both your everyday givers and your largest ones.
- A non-cash readiness checklist for DAF grants, QCDs, stock, and bequests.
About the data
Tithely figures come from aggregate, de-identified 2025 data across approximately 53,000 churches using Tithely for digital giving, limited to U.S. dollar transactions and reported as shares rather than amounts. Because the dataset covers digital giving, it over-represents digitally engaged givers and doesn't include cash or check gifts made outside the platform. Public figures are cited to Giving USA 2026 (Indiana University Lilly Family School of Philanthropy), the MortarStone 2025 Annual Generosity Report, Lake Institute on Faith & Giving, Cerulli Associates, Fidelity Charitable, and the U.S. Bureau of Labor Statistics. Full methodology is in the report.
Citing these figures? Please reference The Generosity Gap: Tithely Church Generosity Report 2026 and link to this page.
podcast transcript
Chris Dunagan is a marketing strategist focused on church tech and digital engagement. He helps churches grow through SEO, email campaigns, and tools like Tithely and Breeze ChMS, with an emphasis on online giving, content strategy, and digital outreach.
Americans gave more to charity in 2025 than in any year on record. However, giving to the church didn't move.
That gap is the subject of The Generosity Gap, Tithely's 2026 Church Generosity Report. We set national research from Giving USA, MortarStone, Lake Institute, and Cerulli Associates against a full year of our own platform data from 53,000 churches.
Below are the headline findings, what they mean for your church, and where to go for the full playbook.
Download the full report: The Generosity Gap (free)
Key church giving statistics for 2026
If you only need the numbers, here they are.
- $617.2 billion: total U.S. charitable giving in 2025, the first year it has ever passed $600 billion (Giving USA 2026).
- −0.2%: change in religious giving in 2025 after inflation. Religion was the only operating sector that did not grow (Giving USA 2026).
- 24.6%: religion's share of all U.S. charitable dollars in 2025, down from roughly half in the early 1990s (Giving USA; Lake Institute).
- −30%: decline in median household church giving since 2022 (MortarStone 2025).
- 21.2%: share of annual church giving that now comes from the top 1% of givers (MortarStone 2025).
- 39%: share of all church gifts made on a Sunday (Tithely transaction data, 2025).
- 11.8%: share of the year's giving that arrives in December (Tithely).
- 17% of gifts carry 64% of dollars: the largest gifts on the platform (Tithely).
- 81%: share of Sunday-morning giving-form visits made on a mobile device (Tithely).
- 3.4 to 1: number of millennial givers it takes to replace the annual giving of one boomer household (MortarStone 2025).
A record year that passed the church by
Giving USA's 2026 report put total American charitable giving at $617.2 billion for 2025, up 5.7% in current dollars and 3.0% after inflation. Individuals gave $394.2 billion of it. Bequests jumped 16.6% after inflation.
Religion remained the largest recipient category at $151.58 billion. In current dollars it grew 2.4%. Adjusted for inflation, it fell 0.2%.
It's tempting to call that "basically flat." But education grew 8.9% after inflation. Public-society benefit grew 8.7%. The environment grew 8.2%. Those causes competed for the same household budgets in the same economy, and they won.
The church didn't lose a fight with the economy. It lost a fight for attention with every other cause asking for donations.
Inflation also hides a quieter decline. Consumer prices rose 24.4% between 2020 and 2025. A family giving $200 a month in 2020 and still giving $200 today has cut its real giving by about a fifth without ever deciding to give less. If your giving is flat in dollars year over year, it fell in real terms.
Fewer givers are carrying more of the load
The national record wasn't built by more Americans giving. It was built by a small number giving very large amounts: megagifts totaled $19.2 billion in 2025.
The same pattern shows up inside local churches. MortarStone's 2025 Annual Generosity Report found that median household giving fell from $800 to $562 between 2022 and 2025, while giving from the top 1% of givers rose 47%. Fewer than half of households who gave in 2021 gave again in 2025.
That's the real risk. A church whose total looks stable may be a church where the middle has quietly fallen out and a handful of families have covered the difference. One retirement or one relocation, and the gap can't be filled.
The warning isn't about major donors, who are usually deeply committed members. It's about everyone else. The metric that matters most in 2026 isn't total giving. It's how many households gave at all, and how many of them give on a recurring basis.
How people actually give: what 11 million gifts show
This is the part of the report unique to Tithely, because it comes directly from transactions on the Tithely platform in calendar year 2025.
Giving runs on payday, not the church calendar
- Sunday carries 39% of all gifts.
- Friday is the peak non-Sunday day, at 15.4% of weekly dollars.
- The 1st and the 15th carry 13% of monthly dollars between them.
- December carries 11.8% of the year and runs 42% above an average month.
People give when they have money, and most people have money on a schedule. An independent dataset from another giving platform landed within about two points of ours on both Sunday and Friday, which is strong confirmation for this kind of pattern.
Source: Tithely internal transaction data, 2025.
Sunday is the participation day, not the dollar day
Sunday takes 39% of gifts but only 27.7% of dollars. The average Sunday gift is 44% smaller than the average Monday gift, and runs about 29% below the average gift across the year. Sunday is where most people give. It isn't where most money is given.
And Sunday giving happens on a phone. 54% of all giving-form visits happen on Sunday morning, and 81% of those are mobile. That means your most important giving interface is a phone screen, held in a pew, by someone with a minute or two of attention. Every extra field or login prompt is a place where someone who meant to give doesn't.
Churches already sense this. Across feature requests submitted to Tithely in 2025, 50% asked for one-tap giving and 18% asked for automated giving reminders. Churches aren't asking for more features. They're asking for fewer steps. That's the idea behind Tithely Tap, which lets a giver tap their phone on an NFC disc and skip the find-the-link step entirely.
A small minority of gifts carries the budget
The largest 17% of gifts carry 64% of all dollars. At the other end, the smallest 56% of gifts carry 13% between them.
That doesn't mean smaller gifts don't matter. They're the participation base and the leading indicator of everything above. It means churches need two different jobs: stewardship for the larger gift, and a frictionless path for the everyday one.
Recurring giving is the stability layer
On the Tithely platform, recurring gifts make up 41.0% of gifts and 32.6% of giving dollars. The seasonal difference is striking: across June, July, and August, one-time giving ran 5.4% below an average month while recurring giving ran 1.7% above it.
Nobody cancels a recurring gift to go on vacation. Every point of recurring share you add is a point of your budget that stops depending on attendance.
Small friction fixes produce measurable gains
When Tithely rebuilt its giving wallet and A/B tested it against the previous version, the new experience delivered +1.2% dollars per visitor, +0.4% conversion, and 10% fewer errors during giving. None of that came from asking anyone to be more generous. It came from removing steps between intent and completion.
Three more forces reshaping church giving
The full report goes deeper on three trends every church leadership team should understand. Here's the short version.
The generational exchange rate. It takes roughly 3.4 millennial givers, or 10 Gen Z givers, to replace the annual giving of one boomer household. Much of that gap is life stage, not conviction, and it closes over time only if a giving habit is in place early. A 28-year-old giving $25 a month automatically is a strategic success.
The 2026 tax code cuts both ways. Starting in tax year 2026, people who take the standard deduction can deduct charitable gifts up to $1,000 (single) or $2,000 (married filing jointly). Roughly nine in ten households take the standard deduction. At the same time, itemizers face a new 0.5%-of-AGI floor on charitable deductions, and top-bracket filers see the value of itemized deductions capped at 35%. The broad base gets a new incentive; your largest givers get a new headwind. (Share the provisions, and point members to their own tax advisor.)
The wealth transfer is arriving in forms churches can't always accept. Cerulli Associates projects $124 trillion will change hands through 2048, including $18 trillion to charity. Much of it will come through donor-advised funds, IRA qualified charitable distributions, and appreciated stock. Half of Fidelity Charitable donors already recommended grants to religious organizations in 2024. A church that can't receive those gifts cleanly never learns what it missed.
What churches can do this week
The report closes with seven moves, each tied to a specific finding and ordered by effort. The first three cost nothing but a decision. Here are two you can act on today:
- Make recurring giving easy to choose. Keep recurring giving options visible and encourage members to set up a schedule that works for them. With Tithely Giving, donors can choose between one-time and recurring gifts and select their preferred giving frequency and date. Churches can also customize giving links to create a simple, convenient giving experience, with no web developer required for those settings.
- Time the ask to payday. Move giving emails and texts to Thursday or Friday, and align campaign deadlines to the 1st and 15th.
The other five, covering the mobile giving path, participation reporting, failed-payment recovery, non-cash readiness, and impact reporting, are in the full report, along with a suggested sequence for rolling them out.
Get the full report
Download The Generosity Gap: Tithely Church Generosity Report 2026
This post covers the headlines. The full report is built to be helpful for your church; it’s not just a list of facts. Inside:
- The Generosity Health Check: a 15-minute, 40-point self-assessment across five areas that tells you which move to start with.
- All seven moves, in full, with the finding behind each and a week-by-week sequence.
- A 12-month generosity calendar mapped to how people actually give, not the program year.
- The three participation numbers to put in front of your board every quarter.
- The 2026 tax playbook for both your everyday givers and your largest ones.
- A non-cash readiness checklist for DAF grants, QCDs, stock, and bequests.
About the data
Tithely figures come from aggregate, de-identified 2025 data across approximately 53,000 churches using Tithely for digital giving, limited to U.S. dollar transactions and reported as shares rather than amounts. Because the dataset covers digital giving, it over-represents digitally engaged givers and doesn't include cash or check gifts made outside the platform. Public figures are cited to Giving USA 2026 (Indiana University Lilly Family School of Philanthropy), the MortarStone 2025 Annual Generosity Report, Lake Institute on Faith & Giving, Cerulli Associates, Fidelity Charitable, and the U.S. Bureau of Labor Statistics. Full methodology is in the report.
Citing these figures? Please reference The Generosity Gap: Tithely Church Generosity Report 2026 and link to this page.
VIDEO transcript
Americans gave more to charity in 2025 than in any year on record. However, giving to the church didn't move.
That gap is the subject of The Generosity Gap, Tithely's 2026 Church Generosity Report. We set national research from Giving USA, MortarStone, Lake Institute, and Cerulli Associates against a full year of our own platform data from 53,000 churches.
Below are the headline findings, what they mean for your church, and where to go for the full playbook.
Download the full report: The Generosity Gap (free)
Key church giving statistics for 2026
If you only need the numbers, here they are.
- $617.2 billion: total U.S. charitable giving in 2025, the first year it has ever passed $600 billion (Giving USA 2026).
- −0.2%: change in religious giving in 2025 after inflation. Religion was the only operating sector that did not grow (Giving USA 2026).
- 24.6%: religion's share of all U.S. charitable dollars in 2025, down from roughly half in the early 1990s (Giving USA; Lake Institute).
- −30%: decline in median household church giving since 2022 (MortarStone 2025).
- 21.2%: share of annual church giving that now comes from the top 1% of givers (MortarStone 2025).
- 39%: share of all church gifts made on a Sunday (Tithely transaction data, 2025).
- 11.8%: share of the year's giving that arrives in December (Tithely).
- 17% of gifts carry 64% of dollars: the largest gifts on the platform (Tithely).
- 81%: share of Sunday-morning giving-form visits made on a mobile device (Tithely).
- 3.4 to 1: number of millennial givers it takes to replace the annual giving of one boomer household (MortarStone 2025).
A record year that passed the church by
Giving USA's 2026 report put total American charitable giving at $617.2 billion for 2025, up 5.7% in current dollars and 3.0% after inflation. Individuals gave $394.2 billion of it. Bequests jumped 16.6% after inflation.
Religion remained the largest recipient category at $151.58 billion. In current dollars it grew 2.4%. Adjusted for inflation, it fell 0.2%.
It's tempting to call that "basically flat." But education grew 8.9% after inflation. Public-society benefit grew 8.7%. The environment grew 8.2%. Those causes competed for the same household budgets in the same economy, and they won.
The church didn't lose a fight with the economy. It lost a fight for attention with every other cause asking for donations.
Inflation also hides a quieter decline. Consumer prices rose 24.4% between 2020 and 2025. A family giving $200 a month in 2020 and still giving $200 today has cut its real giving by about a fifth without ever deciding to give less. If your giving is flat in dollars year over year, it fell in real terms.
Fewer givers are carrying more of the load
The national record wasn't built by more Americans giving. It was built by a small number giving very large amounts: megagifts totaled $19.2 billion in 2025.
The same pattern shows up inside local churches. MortarStone's 2025 Annual Generosity Report found that median household giving fell from $800 to $562 between 2022 and 2025, while giving from the top 1% of givers rose 47%. Fewer than half of households who gave in 2021 gave again in 2025.
That's the real risk. A church whose total looks stable may be a church where the middle has quietly fallen out and a handful of families have covered the difference. One retirement or one relocation, and the gap can't be filled.
The warning isn't about major donors, who are usually deeply committed members. It's about everyone else. The metric that matters most in 2026 isn't total giving. It's how many households gave at all, and how many of them give on a recurring basis.
How people actually give: what 11 million gifts show
This is the part of the report unique to Tithely, because it comes directly from transactions on the Tithely platform in calendar year 2025.
Giving runs on payday, not the church calendar
- Sunday carries 39% of all gifts.
- Friday is the peak non-Sunday day, at 15.4% of weekly dollars.
- The 1st and the 15th carry 13% of monthly dollars between them.
- December carries 11.8% of the year and runs 42% above an average month.
People give when they have money, and most people have money on a schedule. An independent dataset from another giving platform landed within about two points of ours on both Sunday and Friday, which is strong confirmation for this kind of pattern.
Source: Tithely internal transaction data, 2025.
Sunday is the participation day, not the dollar day
Sunday takes 39% of gifts but only 27.7% of dollars. The average Sunday gift is 44% smaller than the average Monday gift, and runs about 29% below the average gift across the year. Sunday is where most people give. It isn't where most money is given.
And Sunday giving happens on a phone. 54% of all giving-form visits happen on Sunday morning, and 81% of those are mobile. That means your most important giving interface is a phone screen, held in a pew, by someone with a minute or two of attention. Every extra field or login prompt is a place where someone who meant to give doesn't.
Churches already sense this. Across feature requests submitted to Tithely in 2025, 50% asked for one-tap giving and 18% asked for automated giving reminders. Churches aren't asking for more features. They're asking for fewer steps. That's the idea behind Tithely Tap, which lets a giver tap their phone on an NFC disc and skip the find-the-link step entirely.
A small minority of gifts carries the budget
The largest 17% of gifts carry 64% of all dollars. At the other end, the smallest 56% of gifts carry 13% between them.
That doesn't mean smaller gifts don't matter. They're the participation base and the leading indicator of everything above. It means churches need two different jobs: stewardship for the larger gift, and a frictionless path for the everyday one.
Recurring giving is the stability layer
On the Tithely platform, recurring gifts make up 41.0% of gifts and 32.6% of giving dollars. The seasonal difference is striking: across June, July, and August, one-time giving ran 5.4% below an average month while recurring giving ran 1.7% above it.
Nobody cancels a recurring gift to go on vacation. Every point of recurring share you add is a point of your budget that stops depending on attendance.
Small friction fixes produce measurable gains
When Tithely rebuilt its giving wallet and A/B tested it against the previous version, the new experience delivered +1.2% dollars per visitor, +0.4% conversion, and 10% fewer errors during giving. None of that came from asking anyone to be more generous. It came from removing steps between intent and completion.
Three more forces reshaping church giving
The full report goes deeper on three trends every church leadership team should understand. Here's the short version.
The generational exchange rate. It takes roughly 3.4 millennial givers, or 10 Gen Z givers, to replace the annual giving of one boomer household. Much of that gap is life stage, not conviction, and it closes over time only if a giving habit is in place early. A 28-year-old giving $25 a month automatically is a strategic success.
The 2026 tax code cuts both ways. Starting in tax year 2026, people who take the standard deduction can deduct charitable gifts up to $1,000 (single) or $2,000 (married filing jointly). Roughly nine in ten households take the standard deduction. At the same time, itemizers face a new 0.5%-of-AGI floor on charitable deductions, and top-bracket filers see the value of itemized deductions capped at 35%. The broad base gets a new incentive; your largest givers get a new headwind. (Share the provisions, and point members to their own tax advisor.)
The wealth transfer is arriving in forms churches can't always accept. Cerulli Associates projects $124 trillion will change hands through 2048, including $18 trillion to charity. Much of it will come through donor-advised funds, IRA qualified charitable distributions, and appreciated stock. Half of Fidelity Charitable donors already recommended grants to religious organizations in 2024. A church that can't receive those gifts cleanly never learns what it missed.
What churches can do this week
The report closes with seven moves, each tied to a specific finding and ordered by effort. The first three cost nothing but a decision. Here are two you can act on today:
- Make recurring giving easy to choose. Keep recurring giving options visible and encourage members to set up a schedule that works for them. With Tithely Giving, donors can choose between one-time and recurring gifts and select their preferred giving frequency and date. Churches can also customize giving links to create a simple, convenient giving experience, with no web developer required for those settings.
- Time the ask to payday. Move giving emails and texts to Thursday or Friday, and align campaign deadlines to the 1st and 15th.
The other five, covering the mobile giving path, participation reporting, failed-payment recovery, non-cash readiness, and impact reporting, are in the full report, along with a suggested sequence for rolling them out.
Get the full report
Download The Generosity Gap: Tithely Church Generosity Report 2026
This post covers the headlines. The full report is built to be helpful for your church; it’s not just a list of facts. Inside:
- The Generosity Health Check: a 15-minute, 40-point self-assessment across five areas that tells you which move to start with.
- All seven moves, in full, with the finding behind each and a week-by-week sequence.
- A 12-month generosity calendar mapped to how people actually give, not the program year.
- The three participation numbers to put in front of your board every quarter.
- The 2026 tax playbook for both your everyday givers and your largest ones.
- A non-cash readiness checklist for DAF grants, QCDs, stock, and bequests.
About the data
Tithely figures come from aggregate, de-identified 2025 data across approximately 53,000 churches using Tithely for digital giving, limited to U.S. dollar transactions and reported as shares rather than amounts. Because the dataset covers digital giving, it over-represents digitally engaged givers and doesn't include cash or check gifts made outside the platform. Public figures are cited to Giving USA 2026 (Indiana University Lilly Family School of Philanthropy), the MortarStone 2025 Annual Generosity Report, Lake Institute on Faith & Giving, Cerulli Associates, Fidelity Charitable, and the U.S. Bureau of Labor Statistics. Full methodology is in the report.
Citing these figures? Please reference The Generosity Gap: Tithely Church Generosity Report 2026 and link to this page.
Sign Up for Product Updates
Chris Dunagan is a marketing strategist focused on church tech and digital engagement. He helps churches grow through SEO, email campaigns, and tools like Tithely and Breeze ChMS, with an emphasis on online giving, content strategy, and digital outreach.

You Might Also Like
More Resources

From increasing giving, managing your congregation, and engaging your church, our collection of resources will keep you up-to-date on the latest church and ministry trends.
Free Resources