The Most Important Giving Trends and Statistics For 2025
Discover the latest church giving trends and statistics for 2025. From Sunday morning donation patterns to year-end generosity spikes, this guide breaks down when, how, and how much people are giving — and what these shifts mean for church leaders seeking to inspire generosity and strengthen financial health.

Church giving trends in 2025 reveal major shifts in donor habits, technology adoption, and seasonal generosity patterns. In this post, we break down the latest church donation statistics, how people are giving, and how churches can adapt.
Digital tithing platforms, changing economic pressures, and evolving demographics are all shaping how, when, and why people give.
Understanding the latest statistics and trends in church giving is crucial for pastors, church leaders, and ministry teams who want to steward resources wisely and foster a culture of generosity.
In this article, we’ll break down the most recent data on giving patterns, highlight key shifts in donor behavior, and explore what these trends mean for the future of church finances.
Whether you're leading a large multi-campus church or a small rural congregation, staying informed about giving trends can help you make better decisions and inspire your congregation to give with purpose and joy.
When Are People Giving?
Weekly Giving Patterns
According to Tithely data:
- The most popular time for giving is Sunday at 11am EST.
- 7% of all weekly transactions happen during this time.
- 30% of weekly giving happens during U.S. church service hours (8am - 3pm EST).
This highlights the importance of talking about giving and generosity during your Sunday service. Use that time to remind people of the blessings that come with giving and how their gifts are making a direct impact on the life of the church.
Monthly Giving Surges
Based on Tithely data:
- December is the highest generosity month, with 11% of all donations coming during December.
- The average amount per donation is 21% higher in December
- The total amount donated in December is 33% higher than any other month.
These statistics highlight how important the month of December is in terms of the church's budget. In December, people often make year-end donations for tax purposes, or simply out of the spirit of giving during the holiday season. It's a good time to encourage a spirit of generosity and look back over the year, and remind people how their giving has made a difference.
How Are People Giving?
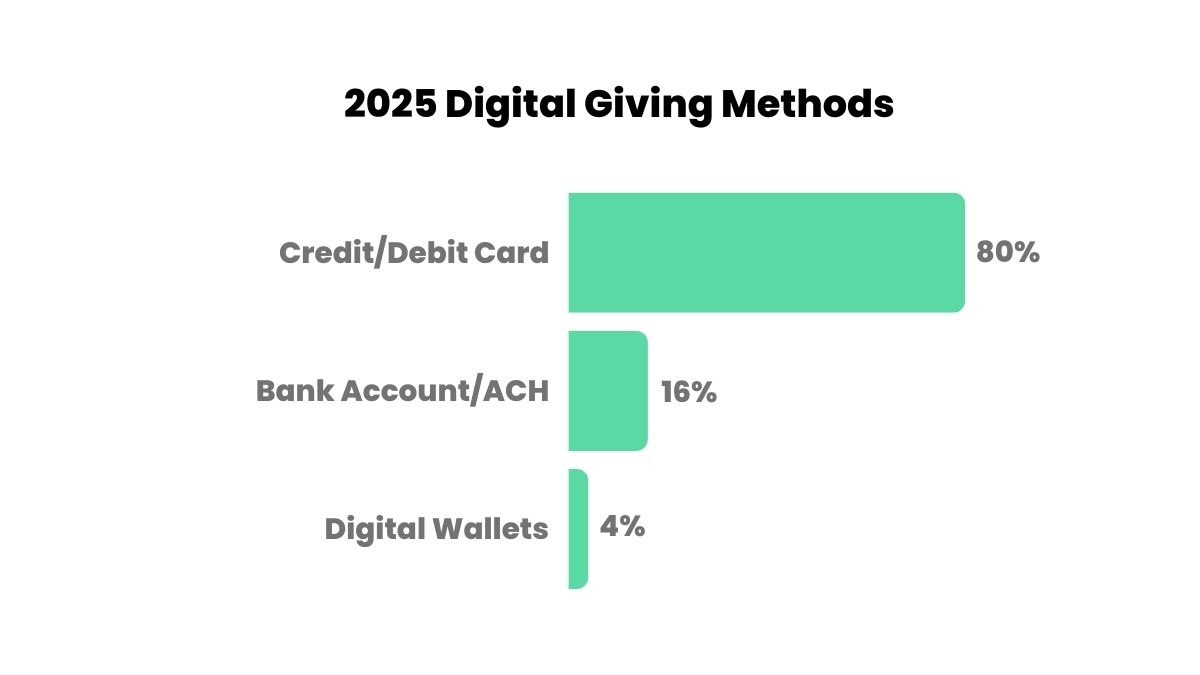
People give to churches in several ways. A whopping 80% of all donations are made with a debit or credit card. If your church doesn't have a way to accept credit/debit card donations, you're missing out on a huge amount of potential donations.
Consider adopting an online giving platform like Tithely so that you can accept all types of donations and not limit yourself to cash or checks.
Online Giving Methods
Around 16% of donations are made with a bank account or via ACH payment. And finally, 4% of all donations are made using a digital wallet like Apple Pay, Google Pay, or Samsung Pay.
In terms of how people submit their online donations, we estimate that approximately 80% of people use a web form and 20% of people use a giving app.
Recurring Giving
Recurring giving, now 37% of all donations and 31% of total volume, simplifies consistent generosity and supports consistent church budgeting.
To grow this area, teach your congregation how to set up recurring gifts and why it matters for faithful stewardship.
How Much Are People Giving to Churches?
Understanding giving trends is essential for churches aiming to build a strong financial foundation. While generosity remains a core value in many faith communities, current data reveals that the majority of churchgoers are not tithing regularly, and overall donation amounts vary widely.
Insights from Nonprofit Source and Tithely shed light on how Americans are contributing financially to their churches. These figures reveal gaps in consistent giving, and opportunities to boost donor engagement, encourage sustainable contributions, and strengthen stewardship.
According to Nonprofit Source:
- Only 5% of Americans regularly tithe (give 10% of their income)
- 80% only give 2% of their income
- Only 3-5% of Americans who give to their local church do so through regular tithing.
According to Tithely data:
- The average donation to churches is $157
- 34.5% of donations are under $50
- Approximately 33% of gifts are between $100 - $249
- Less than 2% of gifts are over $1,000.
Some lessons to be learned from this data.
First, there is a lot of room for churches to grow in consistent giving. There is a great opportunity for churches to remind their members of the importance of generosity and how even small donations can make an impact. Pastors and leaders should regularly communicate the priority of generosity and seek to make it a core value of their churches.
Second, it's vital for churches to nurture relationships with donors who give larger amounts. These donors have the potential to significantly impact the financial stability and growth of the church.
Third, it's important for churches to diversify their giving efforts beyond just relying on large gifts. Encouraging regular giving from all members, regardless of the amount, can provide a steady stream of income for the church.
Key Takeaways on Church Giving in 2025
- Sunday at 11am EST is the most common giving time.
- December brings in the highest volume and value of donations.
- 80% of donations are made via credit/debit cards.
- Only 5% of givers tithe regularly.
- Recurring giving accounts for 37% of donations.
Final Thoughts
As we’ve seen in the latest data, church giving in 2025 continues to evolve, driven by digital convenience, seasonal generosity, and shifting patterns in how people engage with their faith and finances.
From Sunday surges to year-end spikes, the trends are clear: churches that embrace digital tools, clarify impact, and cultivate generosity are set up for long-term financial health.
While numbers vary, the principle remains, generosity fuels both ministry and community.
By paying attention to these trends and adapting accordingly, churches can better support their mission, serve their members, and make a lasting impact in their communities.
Now is the time to take action. Equip your church with the tools and teaching it needs to encourage faithful, joyful, and consistent giving in the year ahead.
Sign Up for Product Updates

Stephen Altrogge lives in Tallahassee, Florida. He is a dad to three wonderful girls and has written for publications like The Gospel Coalition, Church Leaders, Crosswalk, and many more. When he’s not writing, you’ll find him reading or watching The Lord Of the Rings for the 10th time.
Church giving trends in 2025 reveal major shifts in donor habits, technology adoption, and seasonal generosity patterns. In this post, we break down the latest church donation statistics, how people are giving, and how churches can adapt.
Digital tithing platforms, changing economic pressures, and evolving demographics are all shaping how, when, and why people give.
Understanding the latest statistics and trends in church giving is crucial for pastors, church leaders, and ministry teams who want to steward resources wisely and foster a culture of generosity.
In this article, we’ll break down the most recent data on giving patterns, highlight key shifts in donor behavior, and explore what these trends mean for the future of church finances.
Whether you're leading a large multi-campus church or a small rural congregation, staying informed about giving trends can help you make better decisions and inspire your congregation to give with purpose and joy.
When Are People Giving?
Weekly Giving Patterns
According to Tithely data:
- The most popular time for giving is Sunday at 11am EST.
- 7% of all weekly transactions happen during this time.
- 30% of weekly giving happens during U.S. church service hours (8am - 3pm EST).
This highlights the importance of talking about giving and generosity during your Sunday service. Use that time to remind people of the blessings that come with giving and how their gifts are making a direct impact on the life of the church.
Monthly Giving Surges
Based on Tithely data:
- December is the highest generosity month, with 11% of all donations coming during December.
- The average amount per donation is 21% higher in December
- The total amount donated in December is 33% higher than any other month.
These statistics highlight how important the month of December is in terms of the church's budget. In December, people often make year-end donations for tax purposes, or simply out of the spirit of giving during the holiday season. It's a good time to encourage a spirit of generosity and look back over the year, and remind people how their giving has made a difference.
How Are People Giving?
People give to churches in several ways. A whopping 80% of all donations are made with a debit or credit card. If your church doesn't have a way to accept credit/debit card donations, you're missing out on a huge amount of potential donations.
Consider adopting an online giving platform like Tithely so that you can accept all types of donations and not limit yourself to cash or checks.
Online Giving Methods
Around 16% of donations are made with a bank account or via ACH payment. And finally, 4% of all donations are made using a digital wallet like Apple Pay, Google Pay, or Samsung Pay.
In terms of how people submit their online donations, we estimate that approximately 80% of people use a web form and 20% of people use a giving app.
Recurring Giving
Recurring giving, now 37% of all donations and 31% of total volume, simplifies consistent generosity and supports consistent church budgeting.
To grow this area, teach your congregation how to set up recurring gifts and why it matters for faithful stewardship.
How Much Are People Giving to Churches?
Understanding giving trends is essential for churches aiming to build a strong financial foundation. While generosity remains a core value in many faith communities, current data reveals that the majority of churchgoers are not tithing regularly, and overall donation amounts vary widely.
Insights from Nonprofit Source and Tithely shed light on how Americans are contributing financially to their churches. These figures reveal gaps in consistent giving, and opportunities to boost donor engagement, encourage sustainable contributions, and strengthen stewardship.
According to Nonprofit Source:
- Only 5% of Americans regularly tithe (give 10% of their income)
- 80% only give 2% of their income
- Only 3-5% of Americans who give to their local church do so through regular tithing.
According to Tithely data:
- The average donation to churches is $157
- 34.5% of donations are under $50
- Approximately 33% of gifts are between $100 - $249
- Less than 2% of gifts are over $1,000.
Some lessons to be learned from this data.
First, there is a lot of room for churches to grow in consistent giving. There is a great opportunity for churches to remind their members of the importance of generosity and how even small donations can make an impact. Pastors and leaders should regularly communicate the priority of generosity and seek to make it a core value of their churches.
Second, it's vital for churches to nurture relationships with donors who give larger amounts. These donors have the potential to significantly impact the financial stability and growth of the church.
Third, it's important for churches to diversify their giving efforts beyond just relying on large gifts. Encouraging regular giving from all members, regardless of the amount, can provide a steady stream of income for the church.
Key Takeaways on Church Giving in 2025
- Sunday at 11am EST is the most common giving time.
- December brings in the highest volume and value of donations.
- 80% of donations are made via credit/debit cards.
- Only 5% of givers tithe regularly.
- Recurring giving accounts for 37% of donations.
Final Thoughts
As we’ve seen in the latest data, church giving in 2025 continues to evolve, driven by digital convenience, seasonal generosity, and shifting patterns in how people engage with their faith and finances.
From Sunday surges to year-end spikes, the trends are clear: churches that embrace digital tools, clarify impact, and cultivate generosity are set up for long-term financial health.
While numbers vary, the principle remains, generosity fuels both ministry and community.
By paying attention to these trends and adapting accordingly, churches can better support their mission, serve their members, and make a lasting impact in their communities.
Now is the time to take action. Equip your church with the tools and teaching it needs to encourage faithful, joyful, and consistent giving in the year ahead.
podcast transcript
Stephen Altrogge lives in Tallahassee, Florida. He is a dad to three wonderful girls and has written for publications like The Gospel Coalition, Church Leaders, Crosswalk, and many more. When he’s not writing, you’ll find him reading or watching The Lord Of the Rings for the 10th time.
Church giving trends in 2025 reveal major shifts in donor habits, technology adoption, and seasonal generosity patterns. In this post, we break down the latest church donation statistics, how people are giving, and how churches can adapt.
Digital tithing platforms, changing economic pressures, and evolving demographics are all shaping how, when, and why people give.
Understanding the latest statistics and trends in church giving is crucial for pastors, church leaders, and ministry teams who want to steward resources wisely and foster a culture of generosity.
In this article, we’ll break down the most recent data on giving patterns, highlight key shifts in donor behavior, and explore what these trends mean for the future of church finances.
Whether you're leading a large multi-campus church or a small rural congregation, staying informed about giving trends can help you make better decisions and inspire your congregation to give with purpose and joy.
When Are People Giving?
Weekly Giving Patterns
According to Tithely data:
- The most popular time for giving is Sunday at 11am EST.
- 7% of all weekly transactions happen during this time.
- 30% of weekly giving happens during U.S. church service hours (8am - 3pm EST).
This highlights the importance of talking about giving and generosity during your Sunday service. Use that time to remind people of the blessings that come with giving and how their gifts are making a direct impact on the life of the church.
Monthly Giving Surges
Based on Tithely data:
- December is the highest generosity month, with 11% of all donations coming during December.
- The average amount per donation is 21% higher in December
- The total amount donated in December is 33% higher than any other month.
These statistics highlight how important the month of December is in terms of the church's budget. In December, people often make year-end donations for tax purposes, or simply out of the spirit of giving during the holiday season. It's a good time to encourage a spirit of generosity and look back over the year, and remind people how their giving has made a difference.
How Are People Giving?
People give to churches in several ways. A whopping 80% of all donations are made with a debit or credit card. If your church doesn't have a way to accept credit/debit card donations, you're missing out on a huge amount of potential donations.
Consider adopting an online giving platform like Tithely so that you can accept all types of donations and not limit yourself to cash or checks.
Online Giving Methods
Around 16% of donations are made with a bank account or via ACH payment. And finally, 4% of all donations are made using a digital wallet like Apple Pay, Google Pay, or Samsung Pay.
In terms of how people submit their online donations, we estimate that approximately 80% of people use a web form and 20% of people use a giving app.
Recurring Giving
Recurring giving, now 37% of all donations and 31% of total volume, simplifies consistent generosity and supports consistent church budgeting.
To grow this area, teach your congregation how to set up recurring gifts and why it matters for faithful stewardship.
How Much Are People Giving to Churches?
Understanding giving trends is essential for churches aiming to build a strong financial foundation. While generosity remains a core value in many faith communities, current data reveals that the majority of churchgoers are not tithing regularly, and overall donation amounts vary widely.
Insights from Nonprofit Source and Tithely shed light on how Americans are contributing financially to their churches. These figures reveal gaps in consistent giving, and opportunities to boost donor engagement, encourage sustainable contributions, and strengthen stewardship.
According to Nonprofit Source:
- Only 5% of Americans regularly tithe (give 10% of their income)
- 80% only give 2% of their income
- Only 3-5% of Americans who give to their local church do so through regular tithing.
According to Tithely data:
- The average donation to churches is $157
- 34.5% of donations are under $50
- Approximately 33% of gifts are between $100 - $249
- Less than 2% of gifts are over $1,000.
Some lessons to be learned from this data.
First, there is a lot of room for churches to grow in consistent giving. There is a great opportunity for churches to remind their members of the importance of generosity and how even small donations can make an impact. Pastors and leaders should regularly communicate the priority of generosity and seek to make it a core value of their churches.
Second, it's vital for churches to nurture relationships with donors who give larger amounts. These donors have the potential to significantly impact the financial stability and growth of the church.
Third, it's important for churches to diversify their giving efforts beyond just relying on large gifts. Encouraging regular giving from all members, regardless of the amount, can provide a steady stream of income for the church.
Key Takeaways on Church Giving in 2025
- Sunday at 11am EST is the most common giving time.
- December brings in the highest volume and value of donations.
- 80% of donations are made via credit/debit cards.
- Only 5% of givers tithe regularly.
- Recurring giving accounts for 37% of donations.
Final Thoughts
As we’ve seen in the latest data, church giving in 2025 continues to evolve, driven by digital convenience, seasonal generosity, and shifting patterns in how people engage with their faith and finances.
From Sunday surges to year-end spikes, the trends are clear: churches that embrace digital tools, clarify impact, and cultivate generosity are set up for long-term financial health.
While numbers vary, the principle remains, generosity fuels both ministry and community.
By paying attention to these trends and adapting accordingly, churches can better support their mission, serve their members, and make a lasting impact in their communities.
Now is the time to take action. Equip your church with the tools and teaching it needs to encourage faithful, joyful, and consistent giving in the year ahead.
VIDEO transcript
Church giving trends in 2025 reveal major shifts in donor habits, technology adoption, and seasonal generosity patterns. In this post, we break down the latest church donation statistics, how people are giving, and how churches can adapt.
Digital tithing platforms, changing economic pressures, and evolving demographics are all shaping how, when, and why people give.
Understanding the latest statistics and trends in church giving is crucial for pastors, church leaders, and ministry teams who want to steward resources wisely and foster a culture of generosity.
In this article, we’ll break down the most recent data on giving patterns, highlight key shifts in donor behavior, and explore what these trends mean for the future of church finances.
Whether you're leading a large multi-campus church or a small rural congregation, staying informed about giving trends can help you make better decisions and inspire your congregation to give with purpose and joy.
When Are People Giving?
Weekly Giving Patterns
According to Tithely data:
- The most popular time for giving is Sunday at 11am EST.
- 7% of all weekly transactions happen during this time.
- 30% of weekly giving happens during U.S. church service hours (8am - 3pm EST).
This highlights the importance of talking about giving and generosity during your Sunday service. Use that time to remind people of the blessings that come with giving and how their gifts are making a direct impact on the life of the church.
Monthly Giving Surges
Based on Tithely data:
- December is the highest generosity month, with 11% of all donations coming during December.
- The average amount per donation is 21% higher in December
- The total amount donated in December is 33% higher than any other month.
These statistics highlight how important the month of December is in terms of the church's budget. In December, people often make year-end donations for tax purposes, or simply out of the spirit of giving during the holiday season. It's a good time to encourage a spirit of generosity and look back over the year, and remind people how their giving has made a difference.
How Are People Giving?
People give to churches in several ways. A whopping 80% of all donations are made with a debit or credit card. If your church doesn't have a way to accept credit/debit card donations, you're missing out on a huge amount of potential donations.
Consider adopting an online giving platform like Tithely so that you can accept all types of donations and not limit yourself to cash or checks.
Online Giving Methods
Around 16% of donations are made with a bank account or via ACH payment. And finally, 4% of all donations are made using a digital wallet like Apple Pay, Google Pay, or Samsung Pay.
In terms of how people submit their online donations, we estimate that approximately 80% of people use a web form and 20% of people use a giving app.
Recurring Giving
Recurring giving, now 37% of all donations and 31% of total volume, simplifies consistent generosity and supports consistent church budgeting.
To grow this area, teach your congregation how to set up recurring gifts and why it matters for faithful stewardship.
How Much Are People Giving to Churches?
Understanding giving trends is essential for churches aiming to build a strong financial foundation. While generosity remains a core value in many faith communities, current data reveals that the majority of churchgoers are not tithing regularly, and overall donation amounts vary widely.
Insights from Nonprofit Source and Tithely shed light on how Americans are contributing financially to their churches. These figures reveal gaps in consistent giving, and opportunities to boost donor engagement, encourage sustainable contributions, and strengthen stewardship.
According to Nonprofit Source:
- Only 5% of Americans regularly tithe (give 10% of their income)
- 80% only give 2% of their income
- Only 3-5% of Americans who give to their local church do so through regular tithing.
According to Tithely data:
- The average donation to churches is $157
- 34.5% of donations are under $50
- Approximately 33% of gifts are between $100 - $249
- Less than 2% of gifts are over $1,000.
Some lessons to be learned from this data.
First, there is a lot of room for churches to grow in consistent giving. There is a great opportunity for churches to remind their members of the importance of generosity and how even small donations can make an impact. Pastors and leaders should regularly communicate the priority of generosity and seek to make it a core value of their churches.
Second, it's vital for churches to nurture relationships with donors who give larger amounts. These donors have the potential to significantly impact the financial stability and growth of the church.
Third, it's important for churches to diversify their giving efforts beyond just relying on large gifts. Encouraging regular giving from all members, regardless of the amount, can provide a steady stream of income for the church.
Key Takeaways on Church Giving in 2025
- Sunday at 11am EST is the most common giving time.
- December brings in the highest volume and value of donations.
- 80% of donations are made via credit/debit cards.
- Only 5% of givers tithe regularly.
- Recurring giving accounts for 37% of donations.
Final Thoughts
As we’ve seen in the latest data, church giving in 2025 continues to evolve, driven by digital convenience, seasonal generosity, and shifting patterns in how people engage with their faith and finances.
From Sunday surges to year-end spikes, the trends are clear: churches that embrace digital tools, clarify impact, and cultivate generosity are set up for long-term financial health.
While numbers vary, the principle remains, generosity fuels both ministry and community.
By paying attention to these trends and adapting accordingly, churches can better support their mission, serve their members, and make a lasting impact in their communities.
Now is the time to take action. Equip your church with the tools and teaching it needs to encourage faithful, joyful, and consistent giving in the year ahead.
Sign Up for Product Updates
Stephen Altrogge lives in Tallahassee, Florida. He is a dad to three wonderful girls and has written for publications like The Gospel Coalition, Church Leaders, Crosswalk, and many more. When he’s not writing, you’ll find him reading or watching The Lord Of the Rings for the 10th time.

You Might Also Like
More Resources

From increasing giving, managing your congregation, and engaging your church, our collection of resources will keep you up-to-date on the latest church and ministry trends.
Free Resources


.jpeg)